Warning
You are reading an old version of this documentation. If you want up-to-date information, please have a look at 5.3 .3.4 Results

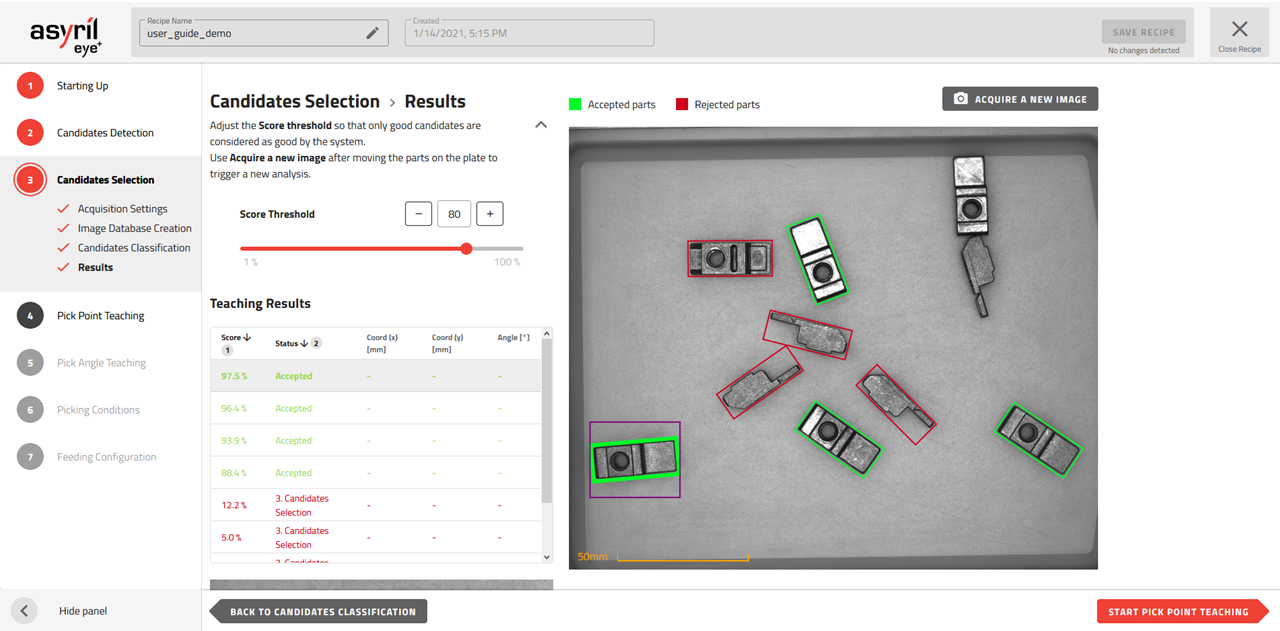
Fig. 75 Candidate Selection - Results
This page presents the result of your classification. A good classification is characterized by a large difference in score between the rejected and accepted parts (for example, the score of good candidates = 88.4% and that of bad candidates = 12.2%). The score represents the probability that a detected part belongs to the label of a good candidate.
By default the threshold is placed at 80% which means that the parts with a score below 80% will be considered as “bad candidate” (i.e. bad orientation) and will be rejected by the algorithm. You may modify the score threshold for your particular application to avoid detecting poorly oriented parts as good candidates.
Green rectangles: accepted candidates
Red rectangles: rejected candidates
Note
Fixing this threshold usually means making a trade-off between rejecting good parts or accepting bad ones (e.g. rejecting false negative or accepting false positive results). Adding more images (candidates) to the classification can increase the robustness of the algorithm in case the gap between good and bad candidates is not wide enough.
Tip
You can manually move the parts on the feeder and then hit the “Acquire a new image” button to analyze a new picture and check if the classification is performing well.
Tip
In the results table, you can sort the parts in ascending order of score and thus easily verify that all parts with a score higher than the threshold correspond to the desired orientation. Adjust the threshold to accept only good parts (surrounded by a green rectangle).