Warning
You are reading an old version of this documentation. If you want up-to-date information, please have a look at 5.4 .3. Results
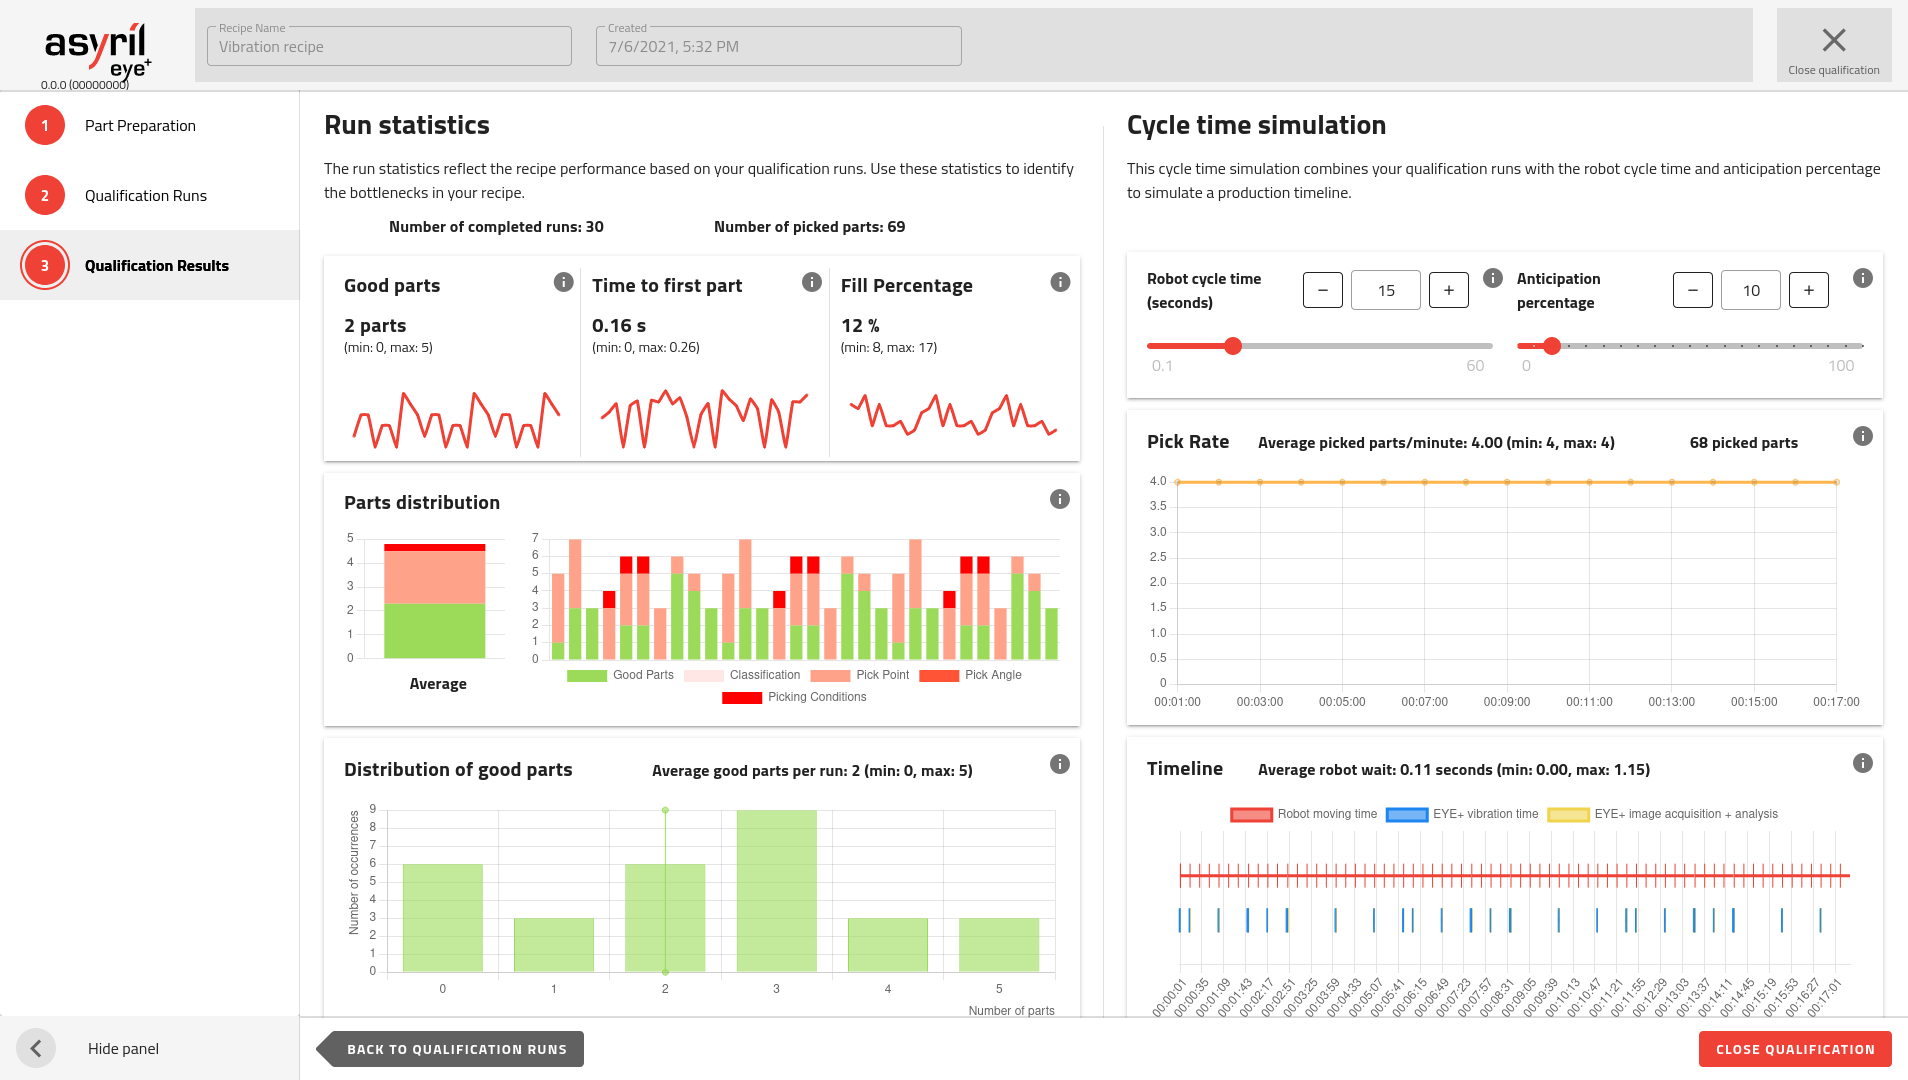
Fig. 133 Qualification Results
This page uses all the collected information and displays it as a summary of all the runs that you performed in the previous step. Then, it allows you to adjust some parameters to simulate a production timeline.
Note
The very first image acquisition as well as the the first vibration aren’t taken into account in the calculation.
Run Statistics
The run statistics are a reflection of the recipe performance based on the qualification runs.
Tip
These statistics are really useful to identify the bottlenecks in the recipe.
Tip
You can add more runs by going back to the previous step (all previous data is kept).
Good parts
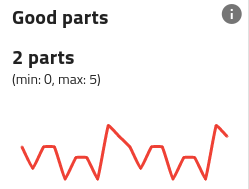
Fig. 134 Run Statistics - Number of good parts
The chart displays the evolution of the number of good parts detected over all qualification runs.
The average value of this metric over all qualification runs is displayed below, as well as its minimum and maximum value (in brackets).
Tip
When no good parts are found, an additional vibration sequence is required. This has a critical impact on the robot waiting time.
Time to first part
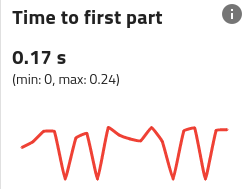
Fig. 135 Run Statistics - Time to first part
The chart displays the evolution of the time the system took to find the first good part over all qualification runs.
The average value of this metric over all qualification runs is displayed below, as well as its minimum and maximum value (in brackets).
Note
This metric directly reflects how optimized your vision recipe is.
Tip
To improve it, consider reducing the number of bad parts reaching the candidate selection step and masking all unnecessary features on the pick-point and pick-angle teaching steps.
Fill percentage
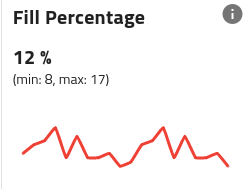
Fig. 136 Run Statistics - Fill percentage
The chart displays the evolution of the fill percentage measured by the image analysis over all qualification runs.
The average value of this metric over all qualification runs is displayed below, as well as its minimum and maximum value (in brackets).
Part distribution
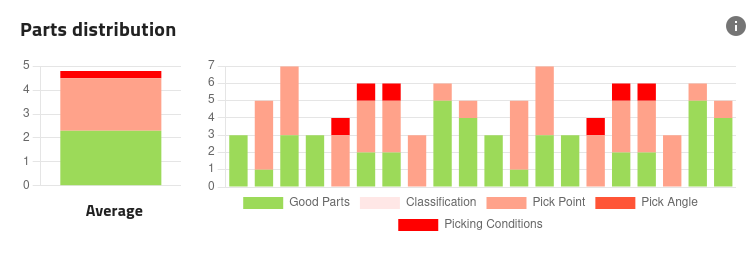
Fig. 137 Run Statistics - Part distribution
The chart on the right side displays the distribution of the parts between accepted and rejected for each qualification run.
The chart on the left side displays the average distribution over all qualification runs.
Tip
Use these charts to identify what step of the recipe could be improved.
Distribution of good parts

Fig. 138 Run Statistics - Distribution of good parts.
This chart displays the distribution of the number of good parts measured during the qualification runs.
Note
If the vibration sequence is longer than the robot cycle time, the robot will be waiting between each vibration sequence. The average number of good parts per run gives an indication about how frequently this waiting will occur.
Tip
When no good parts are found, an additional vibration sequence is required. This has a critical impact on the robot waiting time.
Cycle Time Simulation
This section combines the qualification runs with the theoretical robot cycle time and anticipation percentage to simulate a production timeline.
Use it to assess what impact would the vibration sequence and image analysis have on your production timing.
Robot cycle time
In order to compute the simulation, the robot cycle time must be entered. This value can be changed to monitor the impact on the pick rate and the robot wait.
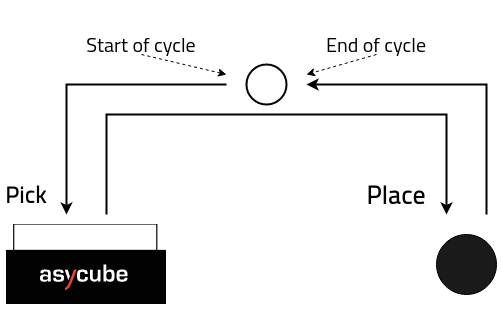
Fig. 139 Illustration of the robot pick and place cycle
Anticipation Percentage
Also linked to the robot is the anticipation percentage. It represents the share of the cycle time as a percentage where EYE+ is allowed to vibrate/take a picture to improve performance by working while the robot is still moving. As the name suggests, this percentage refers to the last X % of the cycle time, where X is the anticipation percentage. For example, if you set this value to 20% with a cycle time of 1000ms, EYE+ will be able to vibrate/take a picture after 800ms (the last 20%).
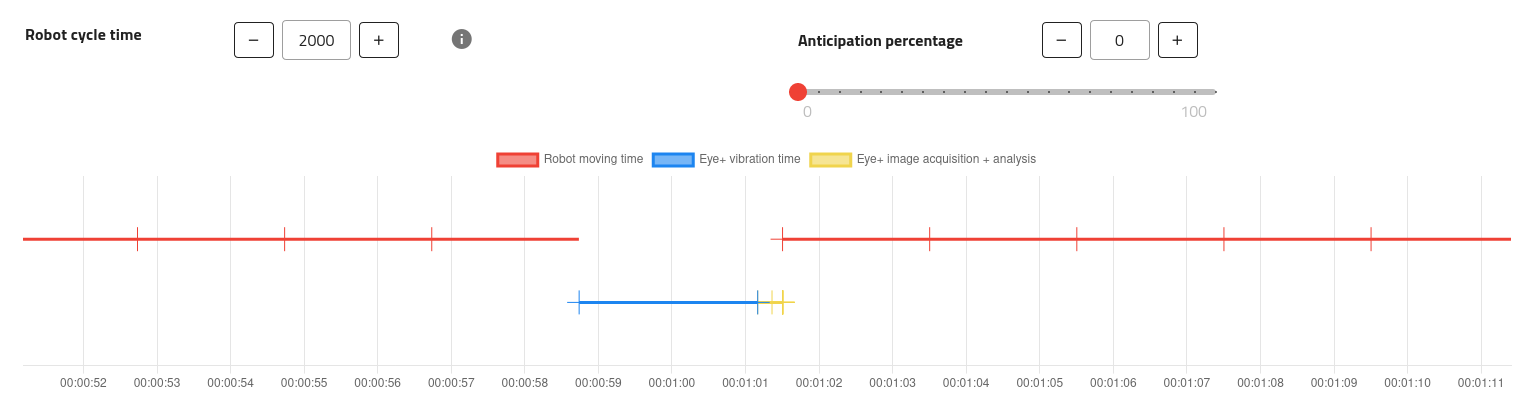
Fig. 140 Timeline with 0% anticipation
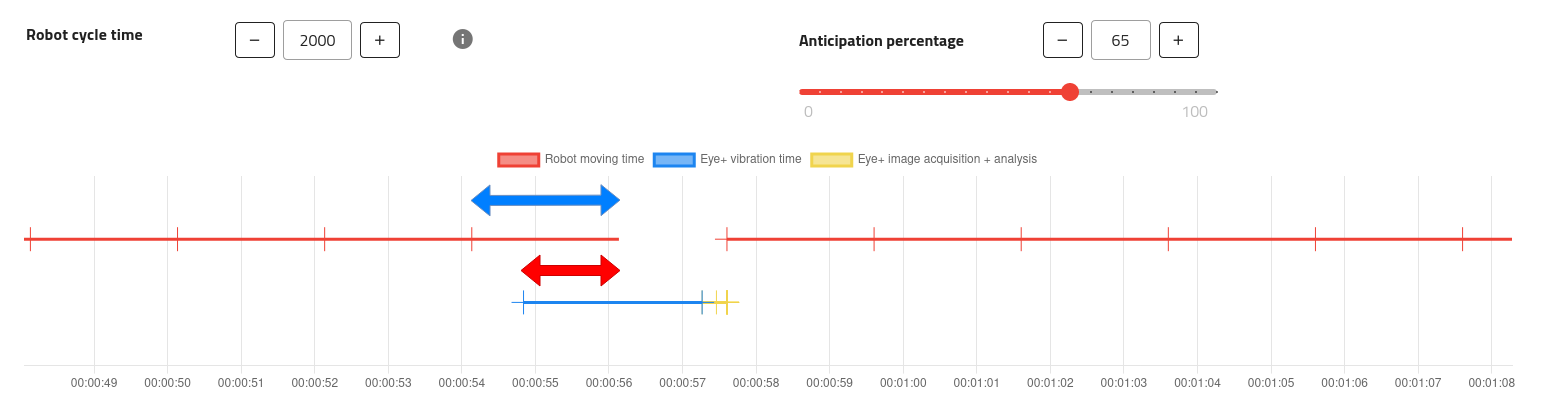
Fig. 141 Timeline with 65% anticipation
In the figure above, as an anticipation percentage of 65% was chosen, the red arrow is exactly 65% of the blue one (1300ms vs 2000ms).
Note
Changing this percentage after performing a single run produces no differences to the data as there won’t be a next vibration to anticipate.
Pick Rate
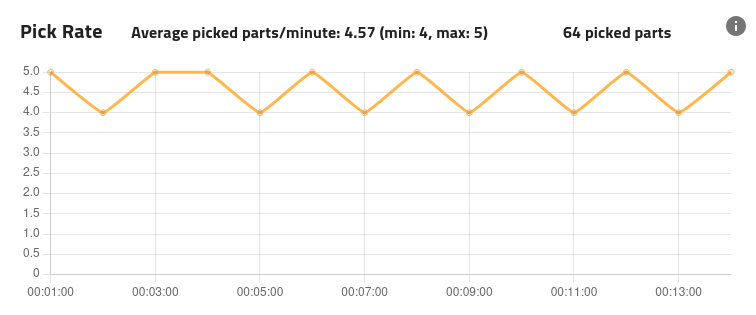
Fig. 142 Cycle time simulation - Pick Rate
The pick rate is calculated using the data from the qualification runs and will vary when changing the robot cycle time and anticipation percentage.
The average, minimum and maximum values are displayed above the graph.
Timeline
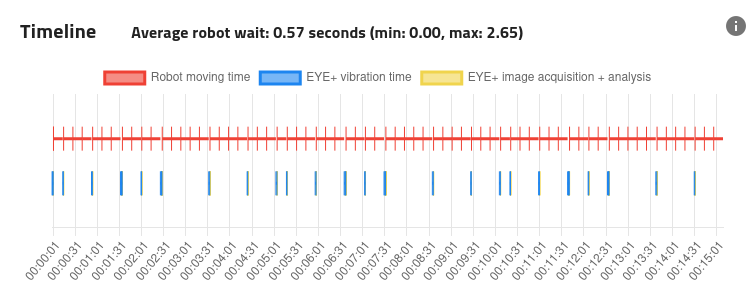
Fig. 143 Cycle time simulation - Timeline
The timeline contains two different tracks, the top one is about the robot while the bottom one is about EYE+. The robot track shows when the robot gets a response to a get_part command with a vertical bar. Each bar on the same continuous line is separated by the value of the robot cycle time, which you can set using the dedicated field.
The EYE+ track shows when the connected Asycube ran a vibration sequence, its duration as well as all vision events, including when an image was captured or when the coordinates of a good part were ready to be transmitted to the robot using the get_part command.
Tip
You may zoom/pan on the timeline to focus on specific points in time using your mouse.